Funder Labs &
Fragment Factory
Breaking into a new market with a customizable research funding tool.
Project Overview: Developing a product from scratch
- Goal:
Expand Elsevier's offering to a new audience: research funders. - Background:
Elsevier had traditionally served researchers and university administrators through tools for publishing, funding management, and research analytics. For the first time, the company explored entering the funder market with a product designed to analyze the funding landscape and support strategic planning. - Discovery:
I conducted in-depth interviews with funding organizations worldwide—across disciplines, sectors (public and private), and funding scales. The complexity and variety of this audience revealed significant knowledge gaps and opportunities. - Hypothesis:
Funding organizations invest heavily in understanding the research landscape. Elsevier’s existing research metadata could be leveraged to meet this need and deliver high-value insights. - Outcome:
While Elsevier ultimately decided not to enter the market due to strong incumbent competition, components developed during this initiative were successfully integrated into other products, enabling them to surface funding data for existing users.
Discovery
Developing a new product required deep exploration of both our target audience and the existing market
landscape—including competitors and alternative solutions.
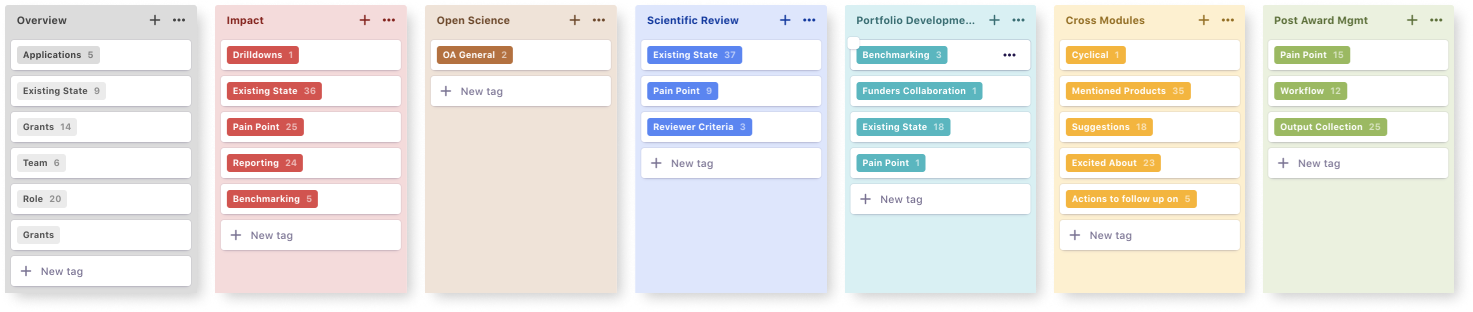
To structure our research, I created a standardized script for meetings with potential
development partners. This allowed me to later categorize users by organization size, area of expertise,
and more. Analyzing these interviews helped me identify common use cases, recurring pain points, and
frequently mentioned tools—forming the foundation for defining user personas.
I also examined existing solutions through websites, webinars, tutorials, and testimonials. This informed
our value proposition and helped me understand where our product could stand out. Products mentioned in
interviews gave me insight into what users are already willing to pay for, guiding further research into
what they truly consider valuable.
 Internally, I held share-back sessions to communicate findings with stakeholders across the organization
and align around emerging insights.
Internally, I held share-back sessions to communicate findings with stakeholders across the organization
and align around emerging insights.

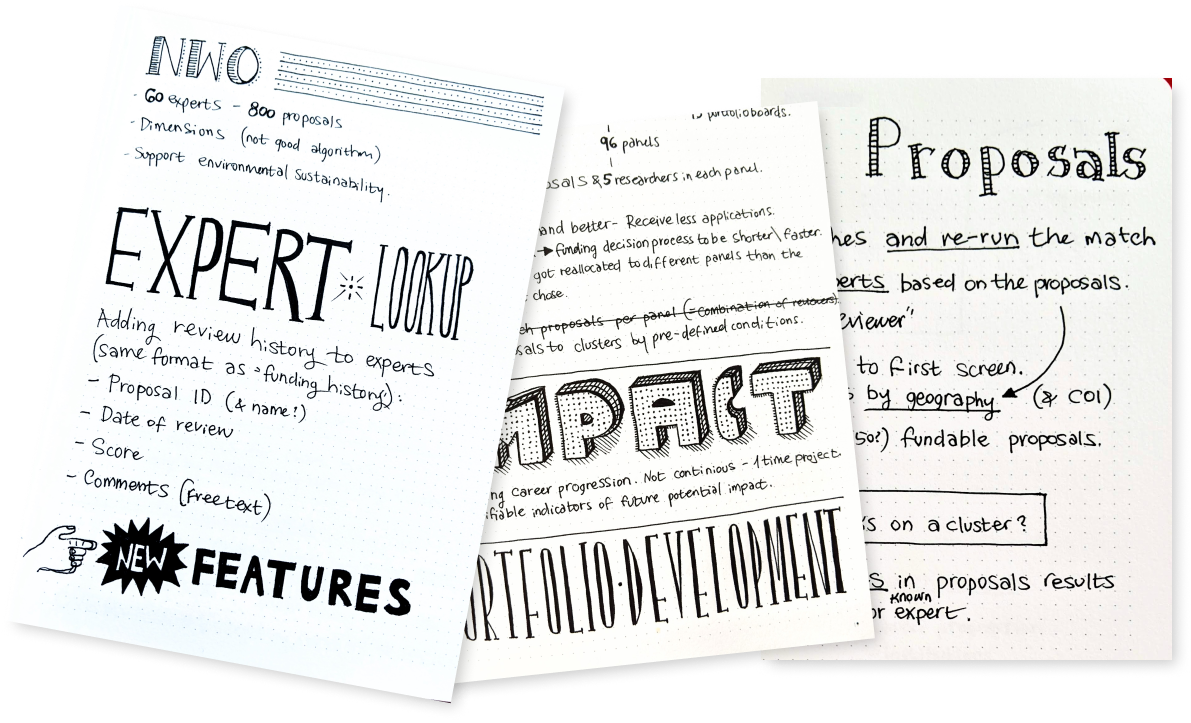
Research
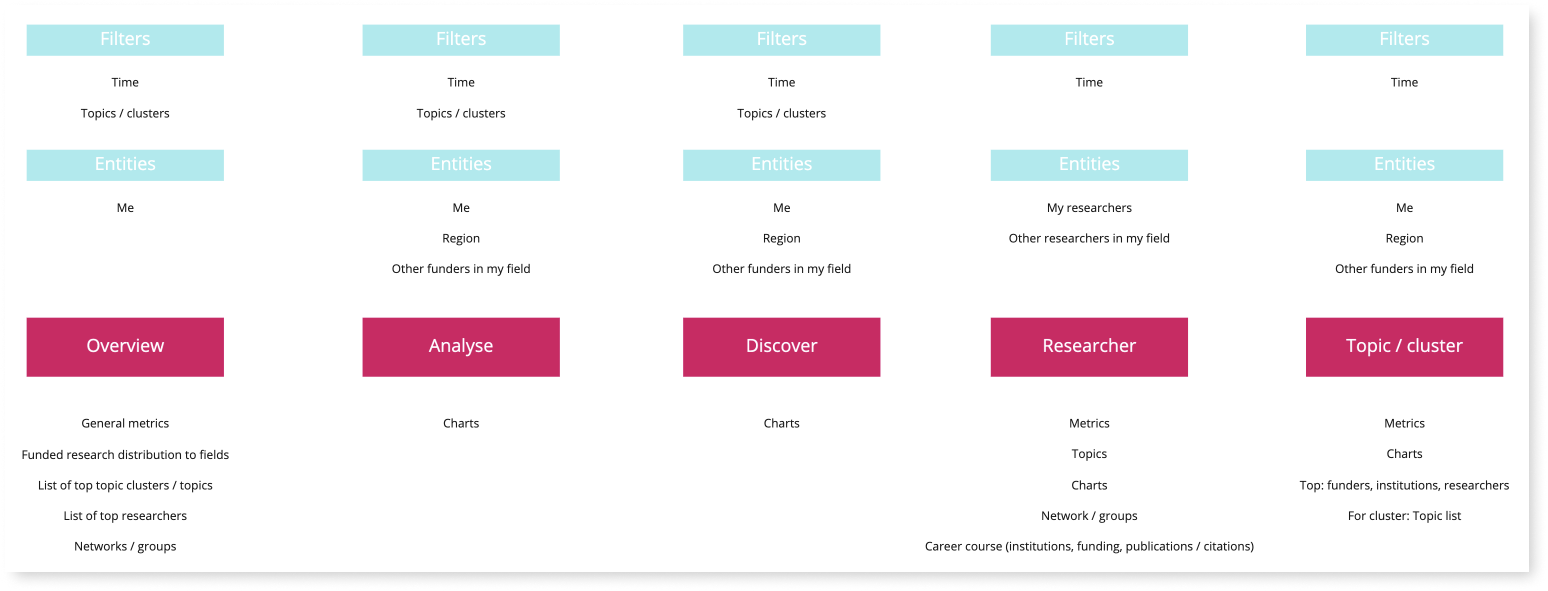
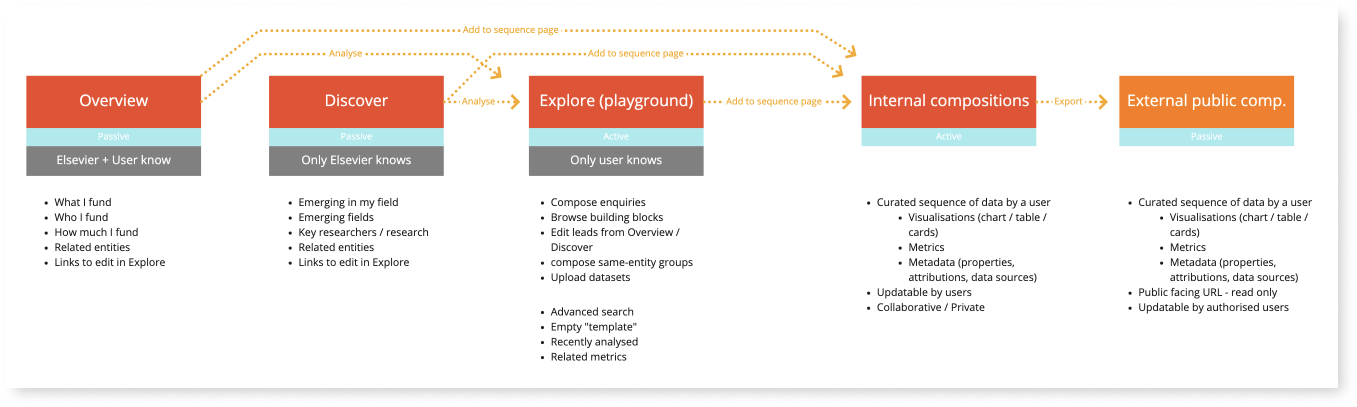
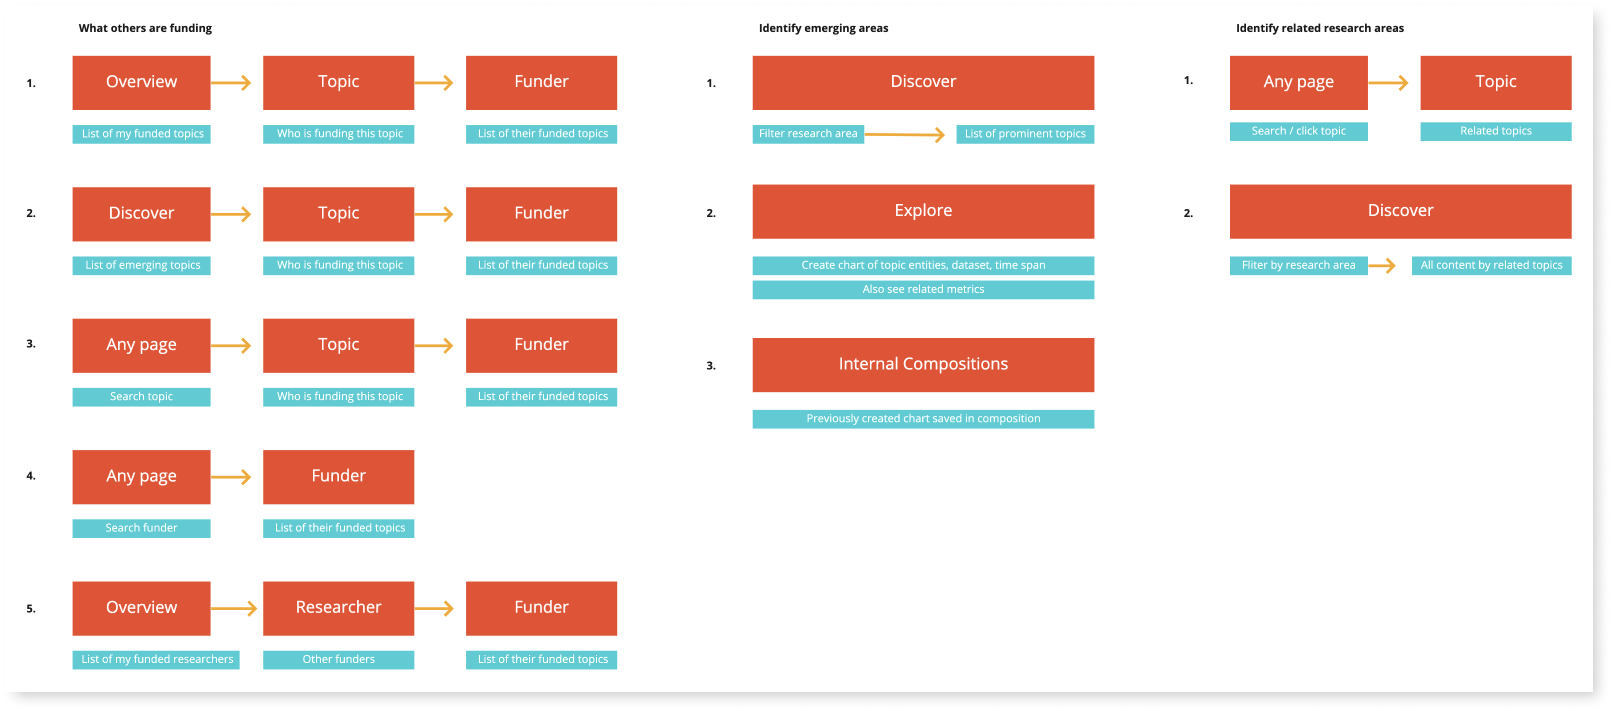
As research progressed, each session brought more focus and precision. I began sketching user flows while
assessing data availability and quality. These flowcharts and data maps played a key role in aligning
stakeholders around the product's intended direction.
Product Owners and Tech Leads gained an early view of the product’s potential shape. The visual
outputs helped them assess scope, communicate internally within their teams, and build confidence that the
product could deliver real value.
Learnings from Discovery
- Funding organizations collect and require different types and volumes of data.
- Data are stored, analyzed, and used differently—not only across organizations but also between roles within the same organization.
- To meet these diverse needs, the product must be modular and flexible, allowing quick assembly of personalized configurations but is complicated to develop.
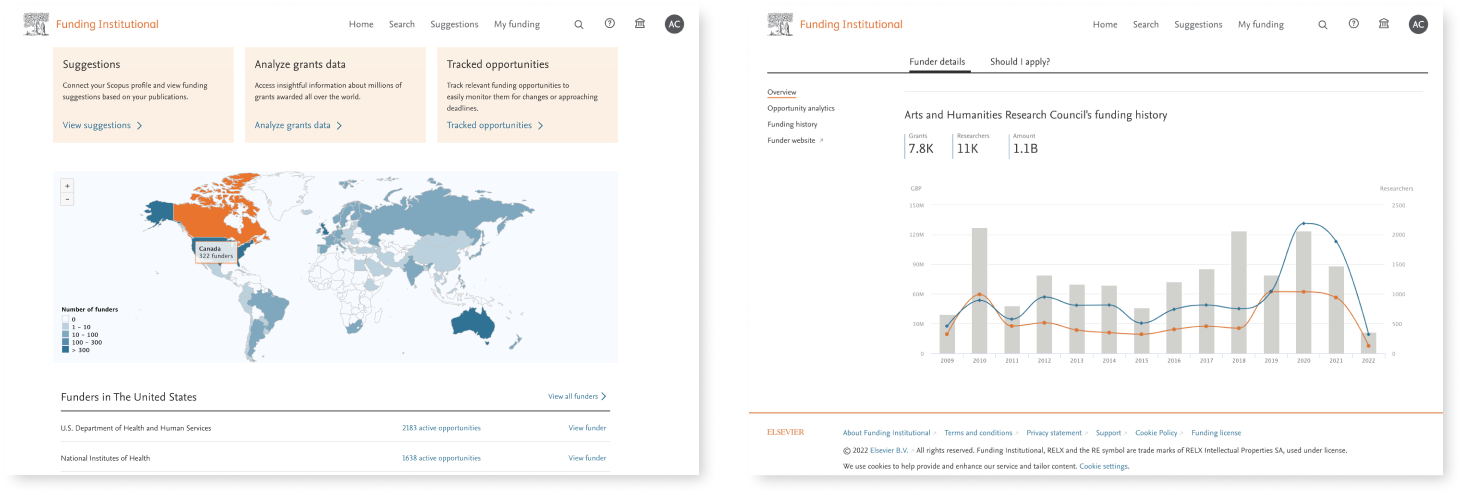
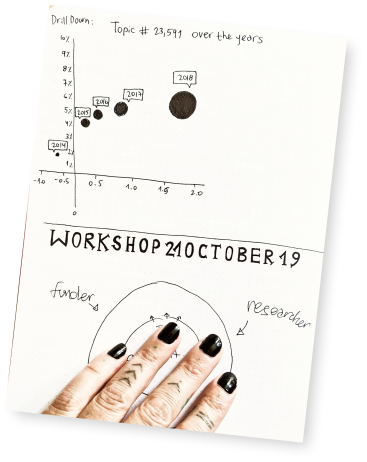
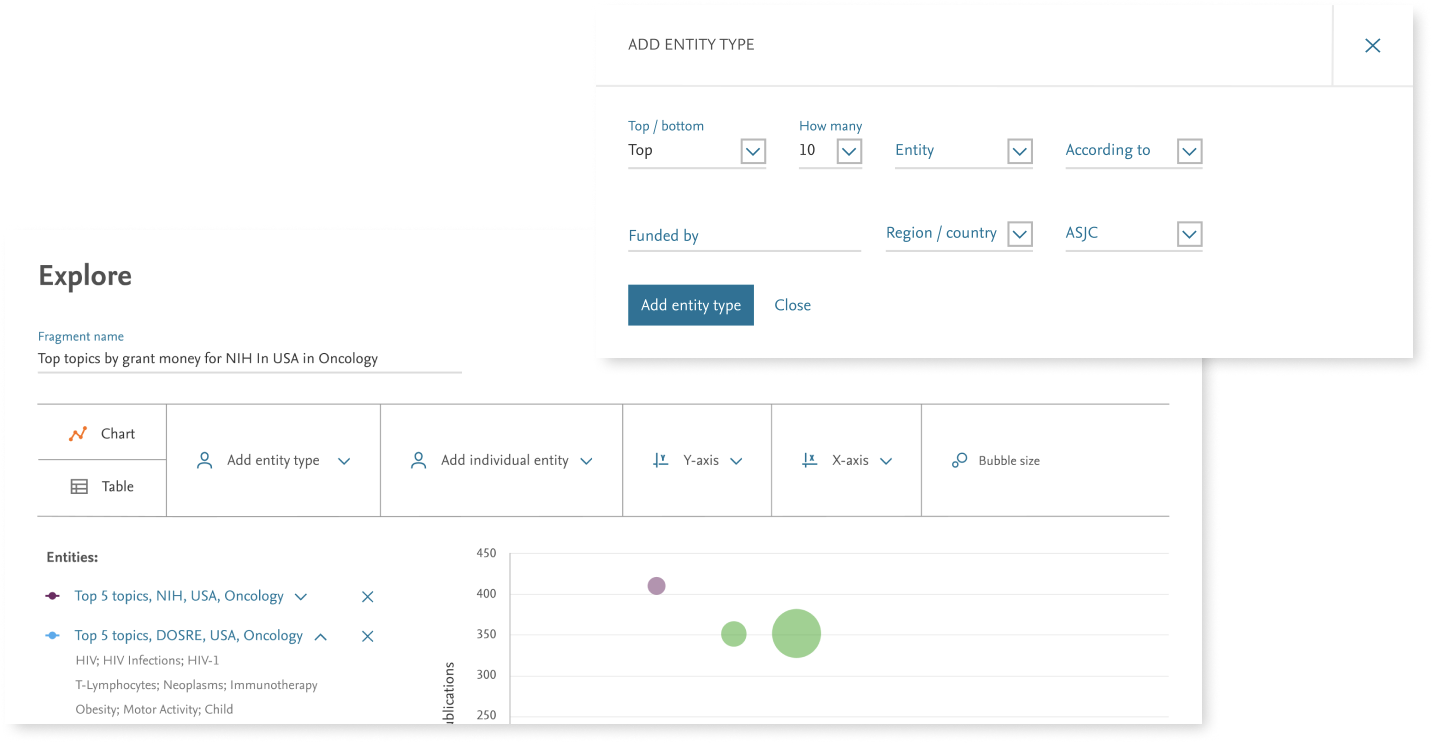
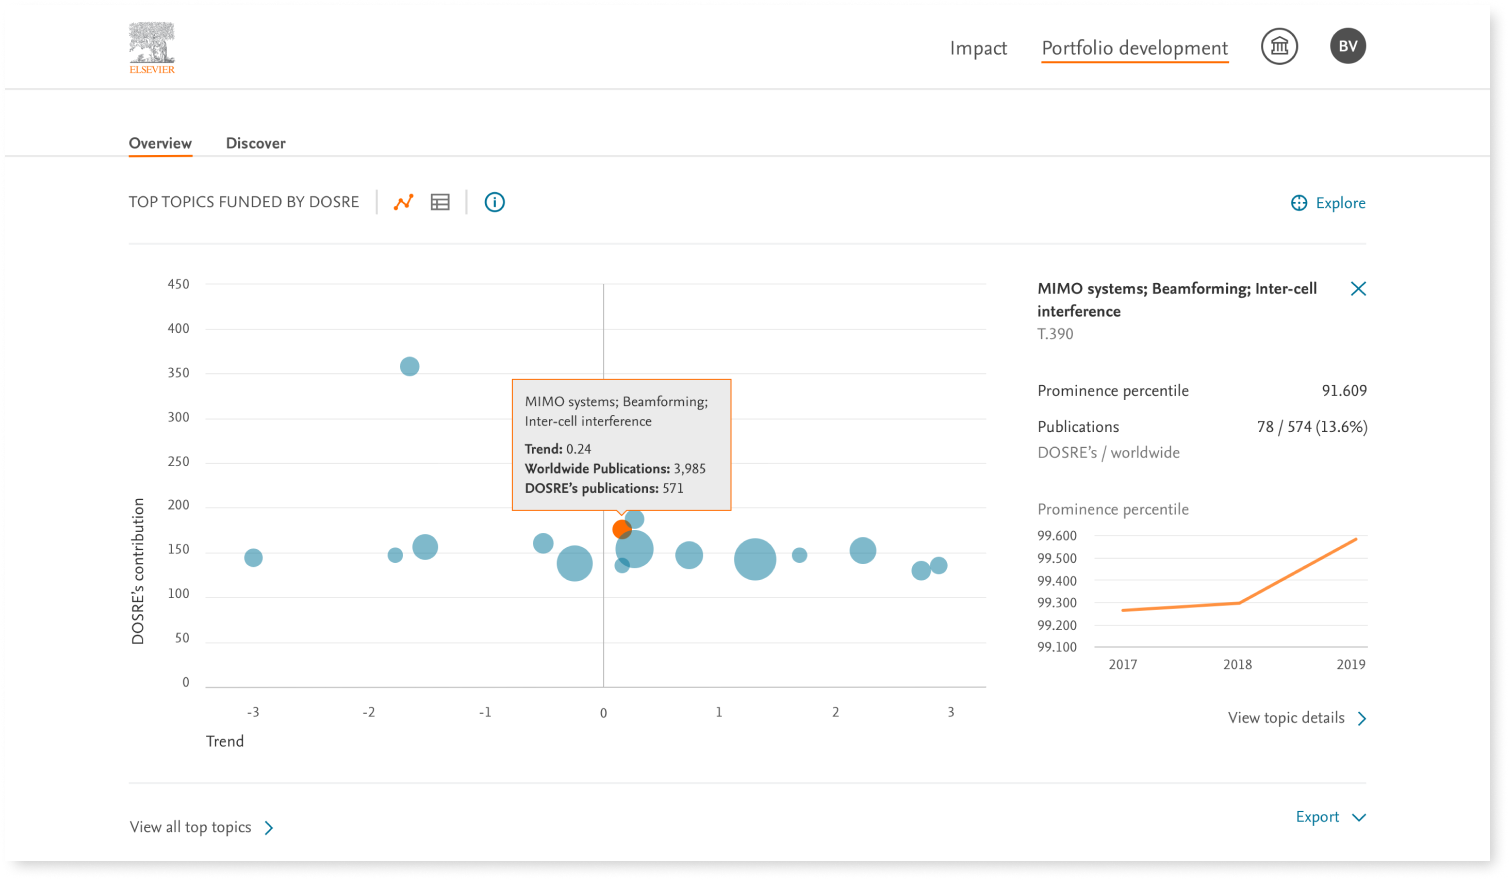
Prototype
During user interviews, visual concepts were well received, but it became clear that their value hinged on the quality of data we could deliver. To truly support decision-making, I needed to test with real data, not static mockups.
At the time, integrating data into a single infographic took a full day of development—too slow for
iterative testing. To address this, the Product Owner, Engineering Lead, and I launched a one-week
hackathon to build the Fragment Factory: a system that enabled rapid prototyping of charts and tables
using real data in minutes.
This tool allowed me to simulate realistic scenarios, validate user expectations, and refine the
product based on genuine data-driven interactions.
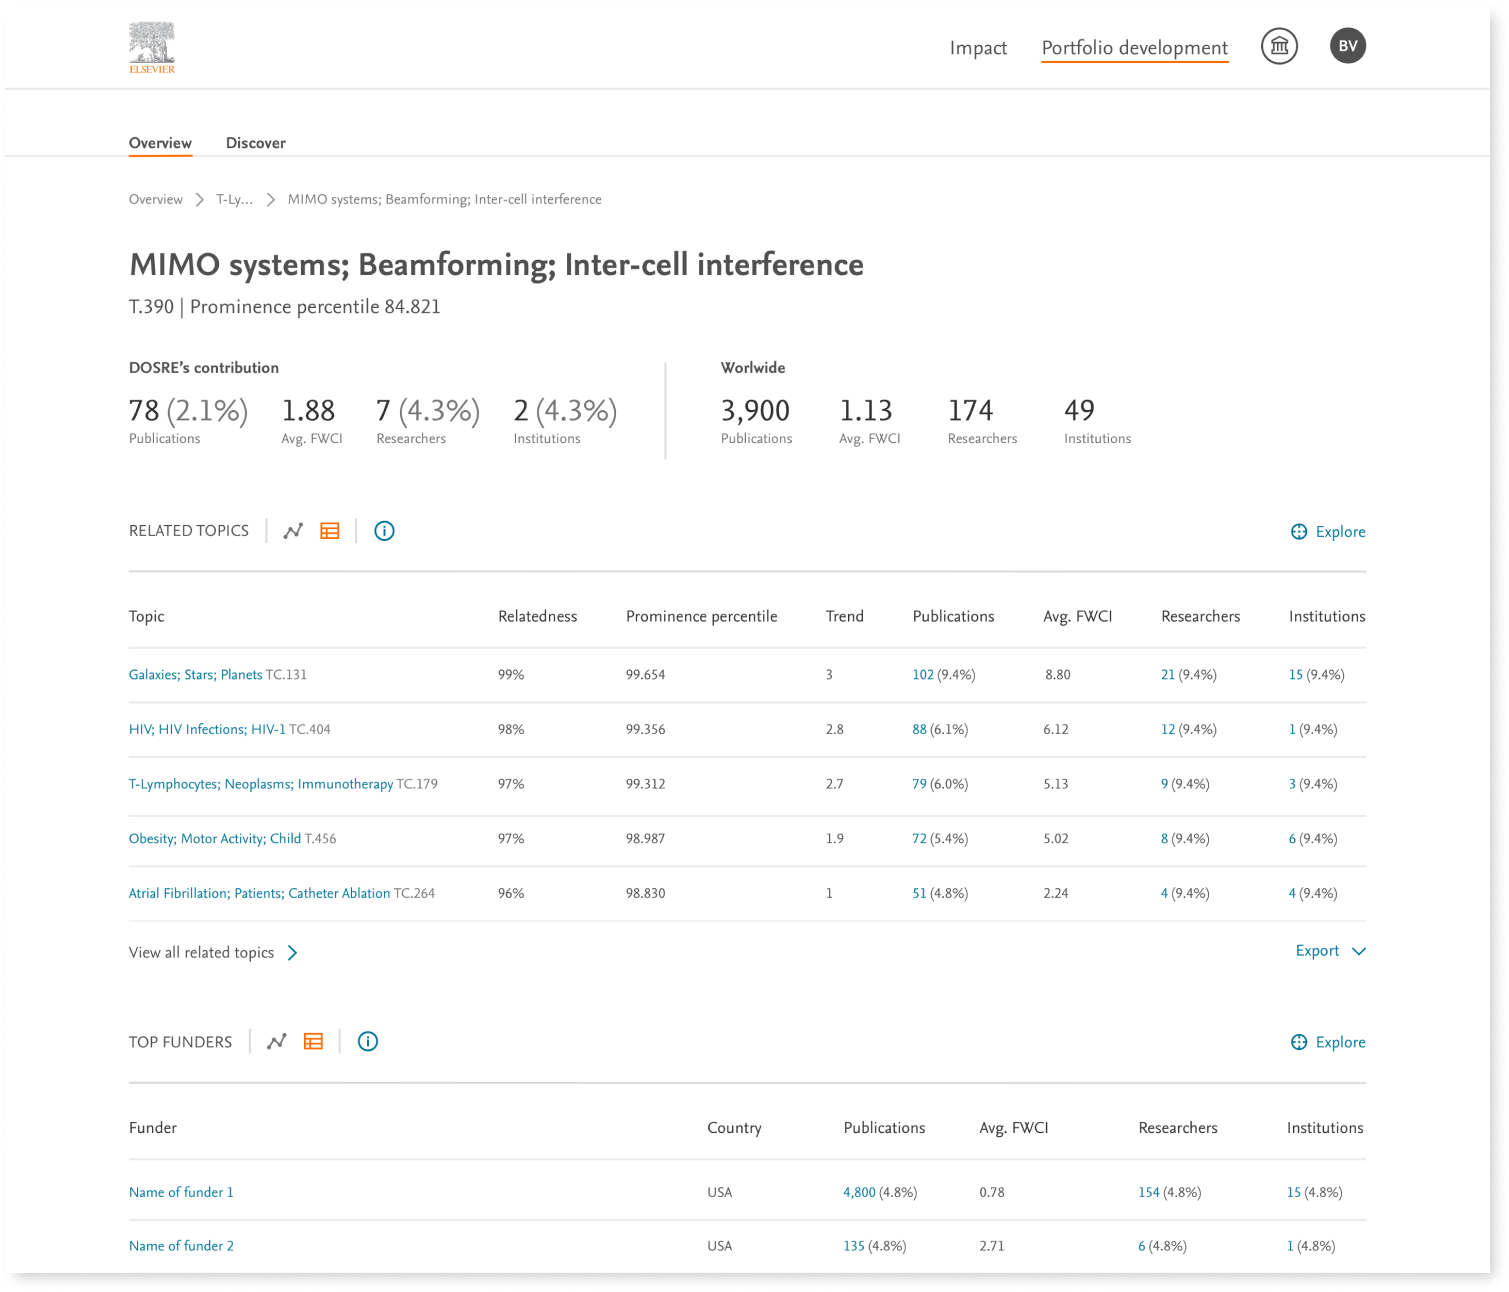
Design
This design approach aligned with broader efforts across the company, ensuring consistency and coherence with other evolving products.
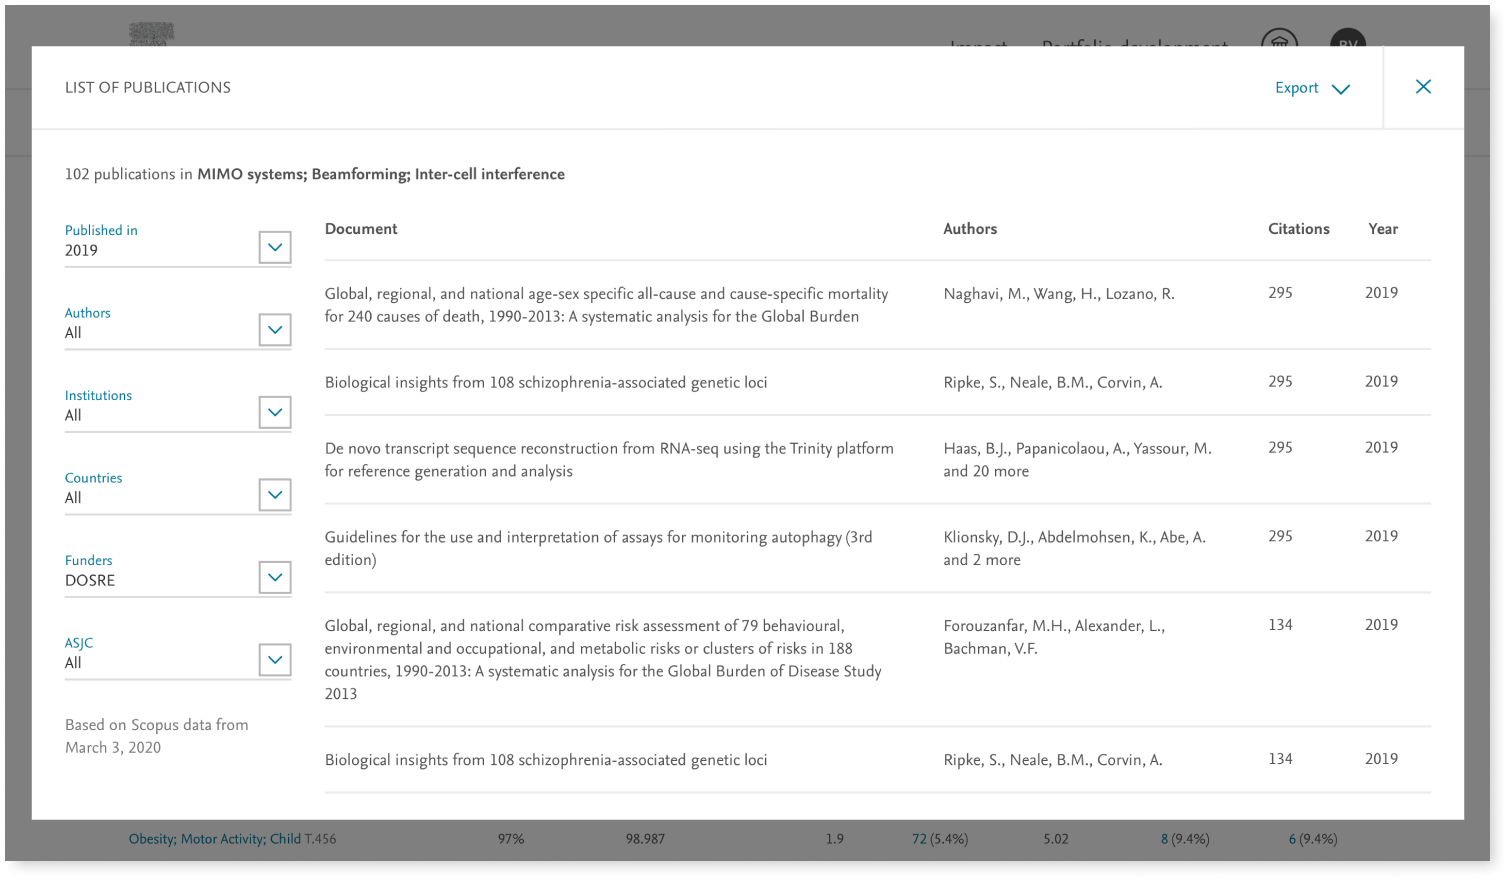
Outcome
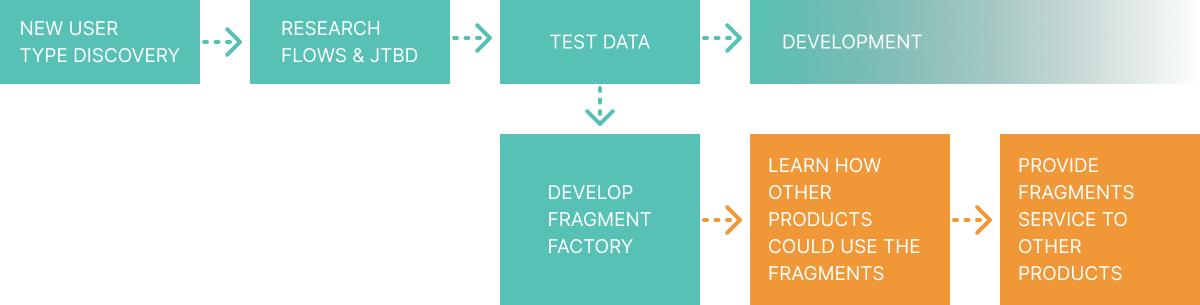
By adhering to the brand guidelines and UI library from the outset, the fragments were production-ready and seamlessly reusable across products like Scopus, SciVal, and Funding Institutional—now serving thousands of users worldwide.